← All projects

Formula Student Wind Tunnel Testing and CFD Validation

Wind Tunnel Formula Student Experimental Correlation

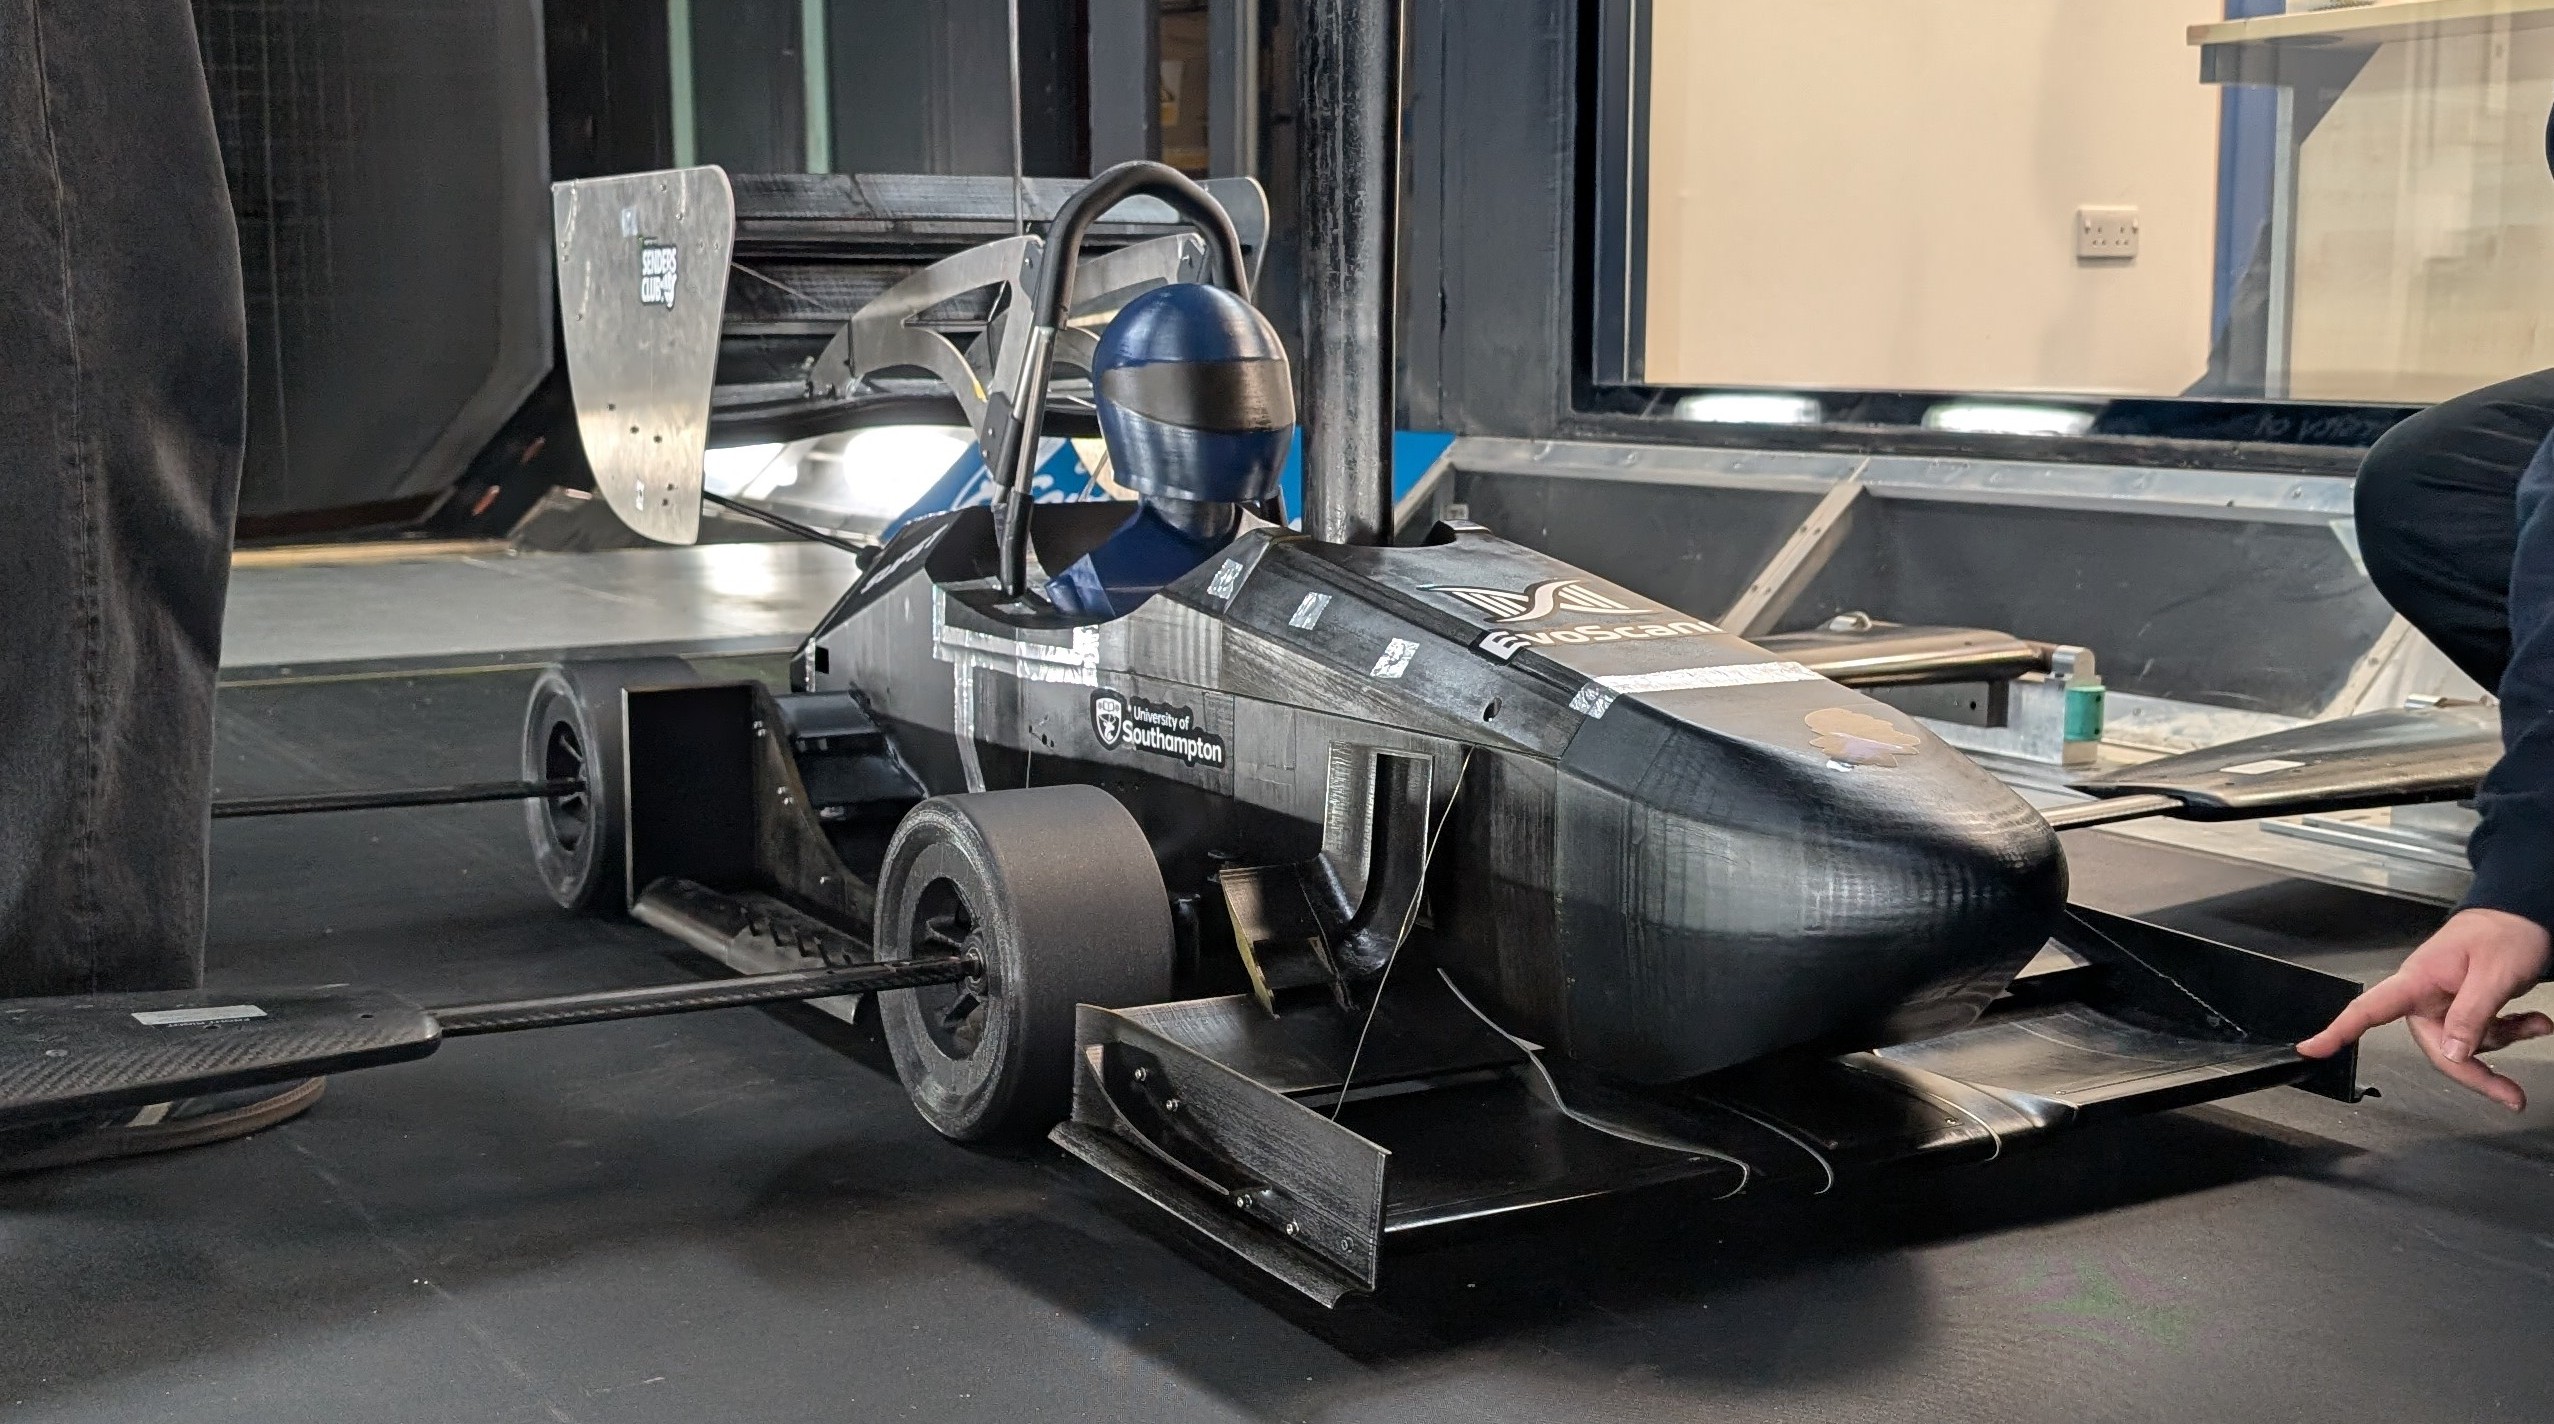
A 50% scale vehicle was tested across various operating conditions to validate the CFD setup.

50% scale Formula Student wind-tunnel test

Overview

As part of the Southampton University Formula Student Team, I supported the setup and execution of our wind tunnel testing campaign.

The resulting experimental data were then used to validate our CFD simulations. Force-balance measurements, surface pressure tappings, and flow visualisation comparisons were used to achieve this.

Methodology

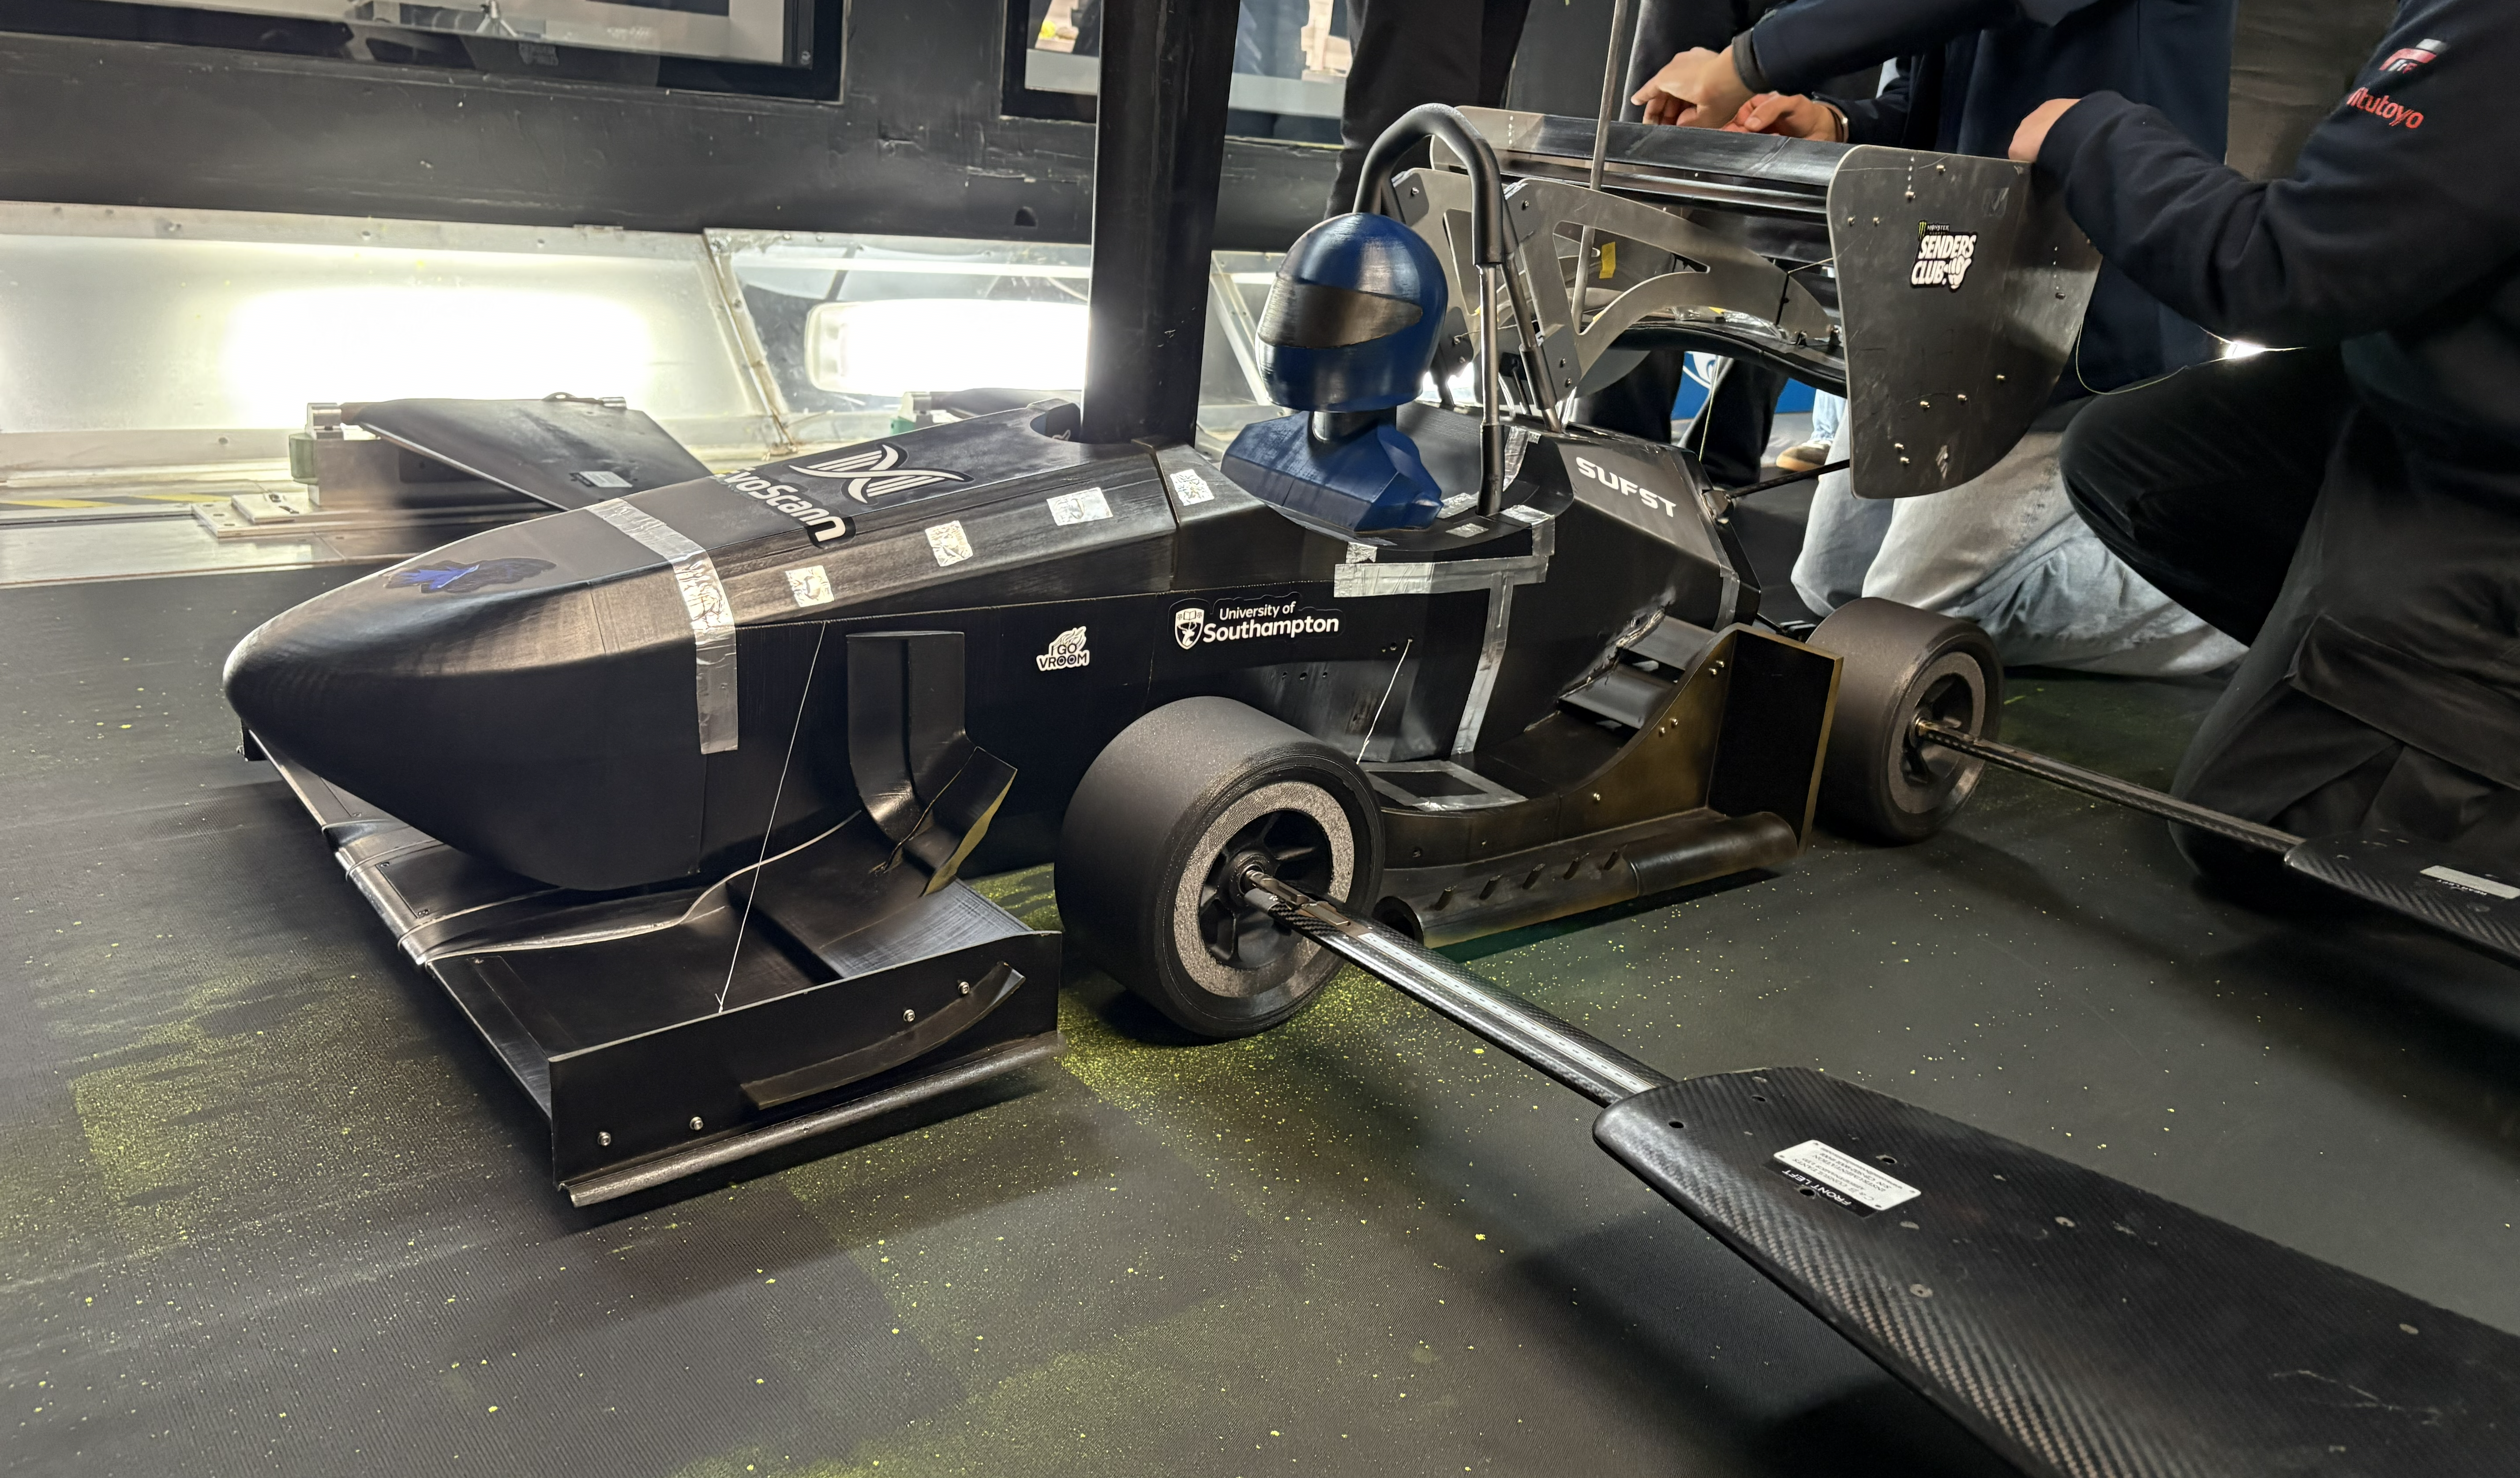
Formula Student wind-tunnel setup

Wind-Tunnel Setup

We instrumented the aerodynamic package with 24 pressure tappings to capture precise static pressure readings.

Attaching the vehicle spine directly to the moment and force balance enabled control and measurement of rake angles.
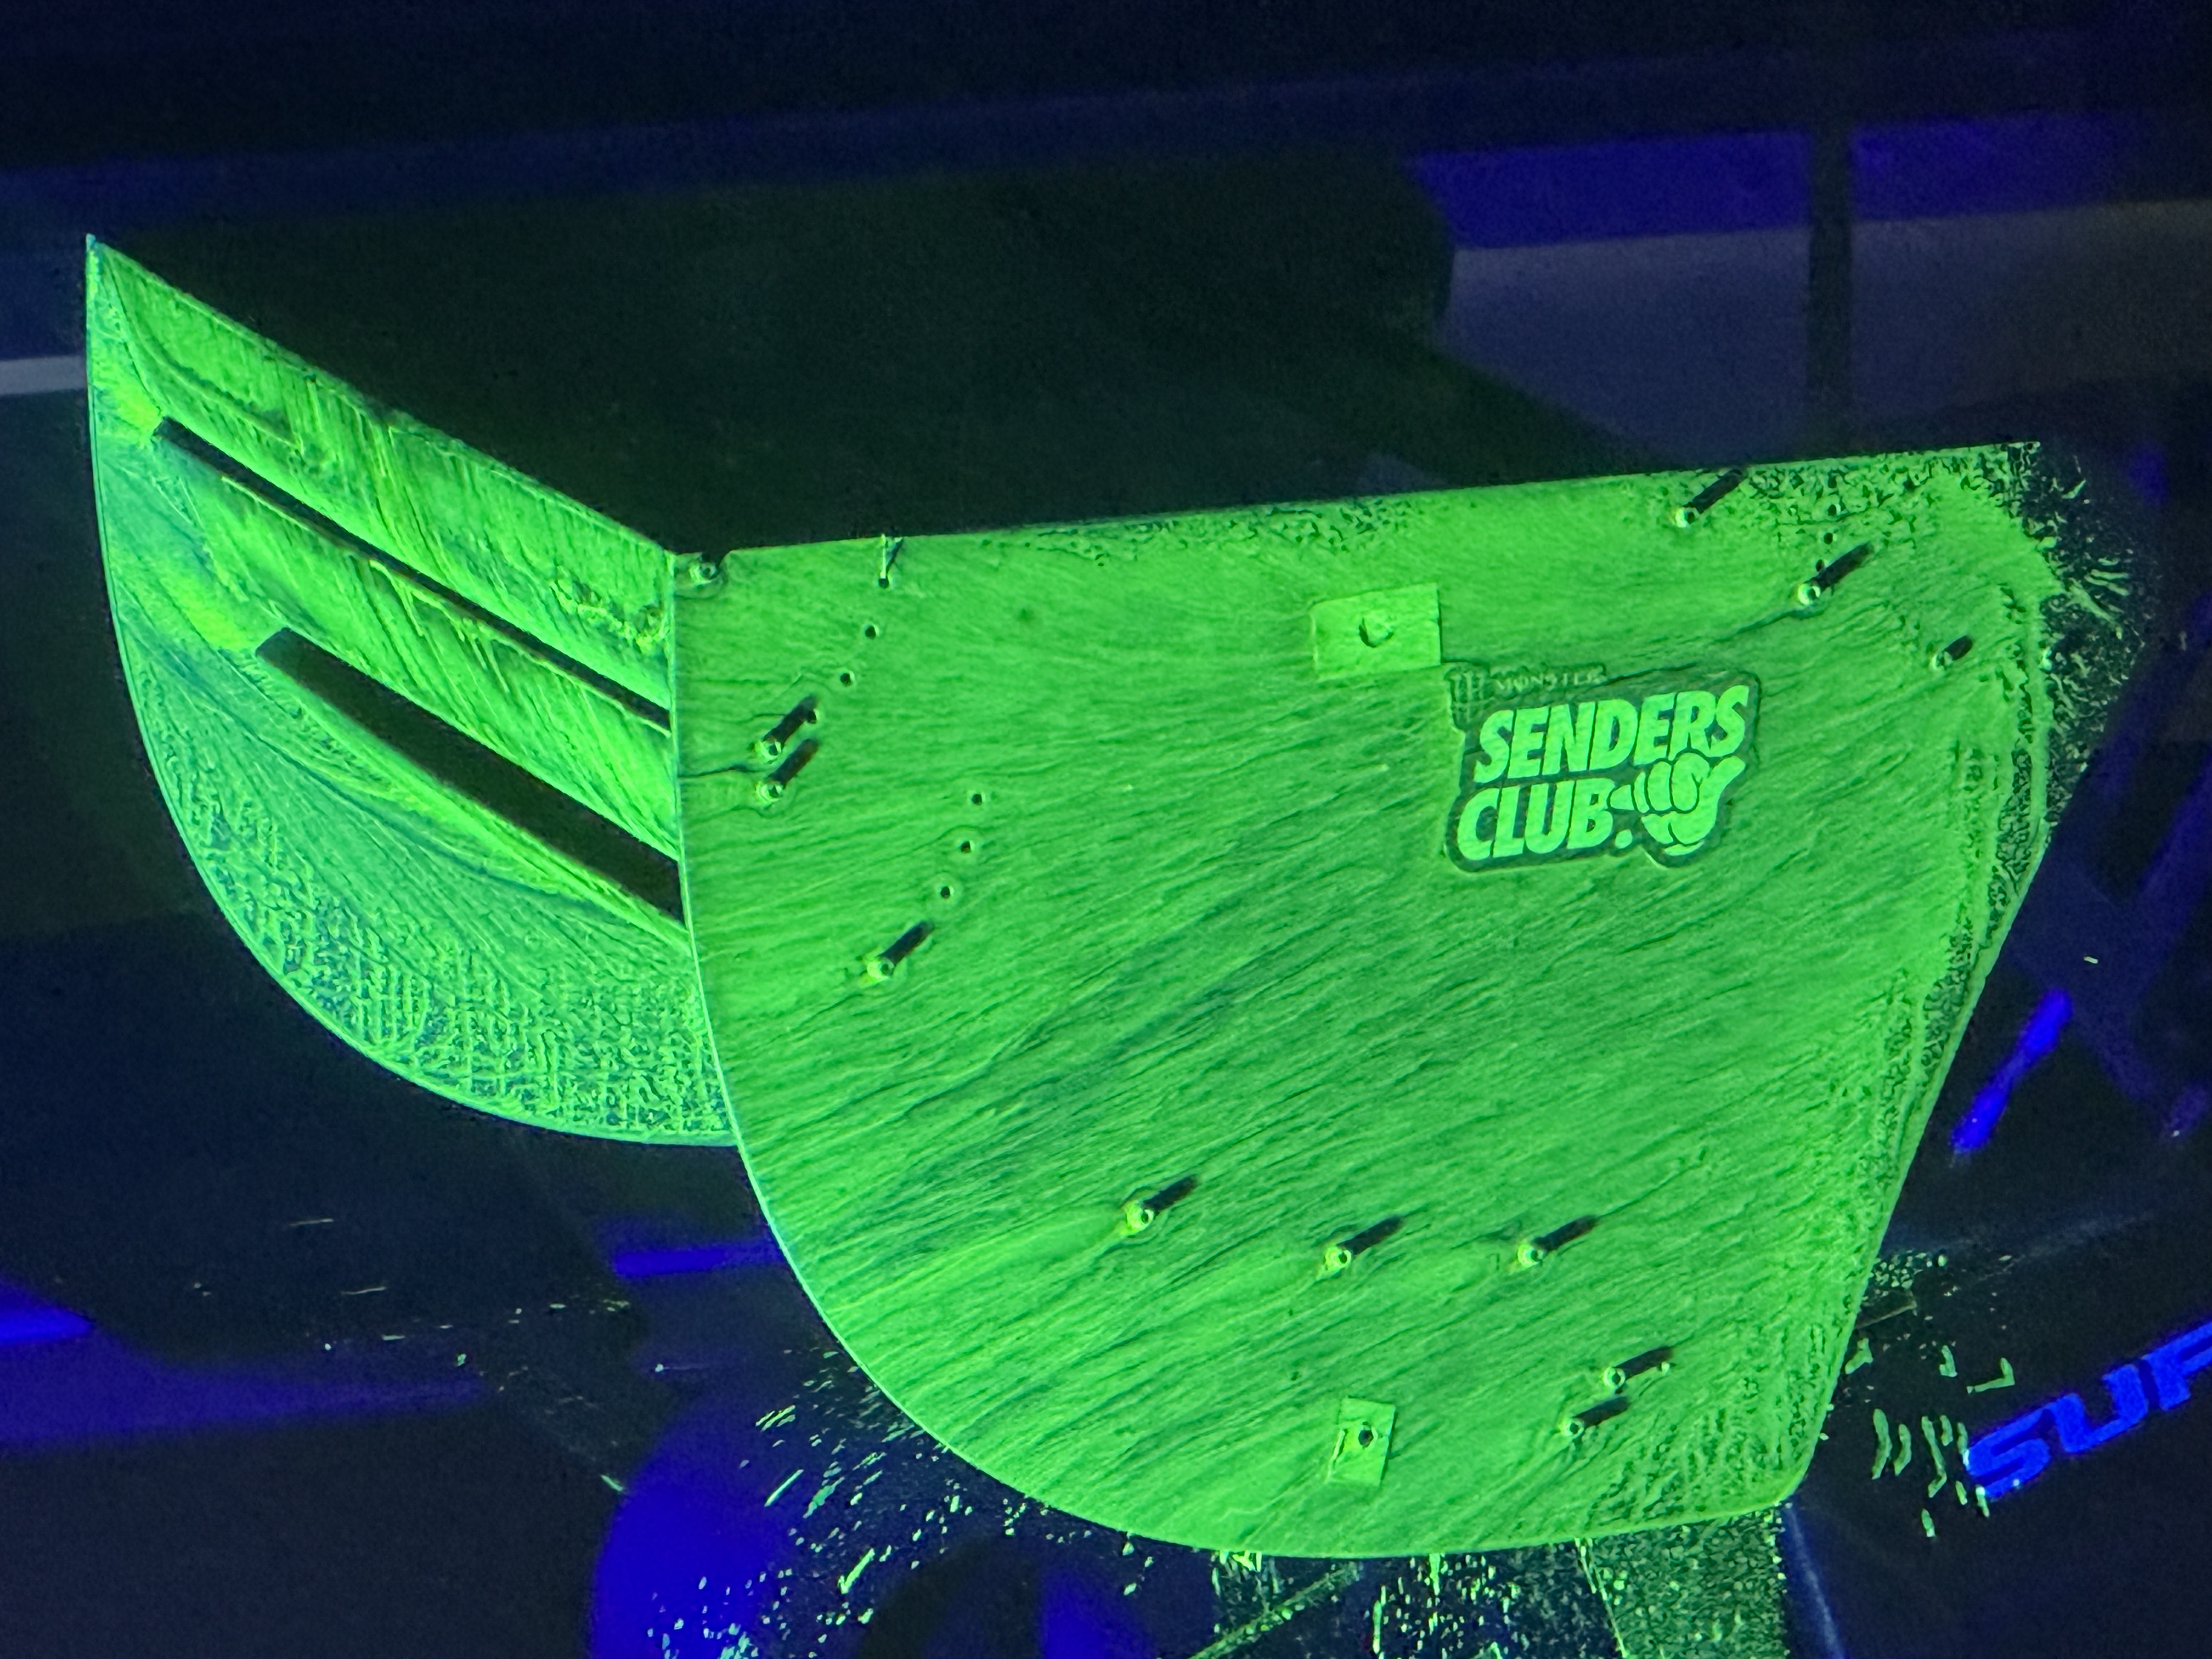
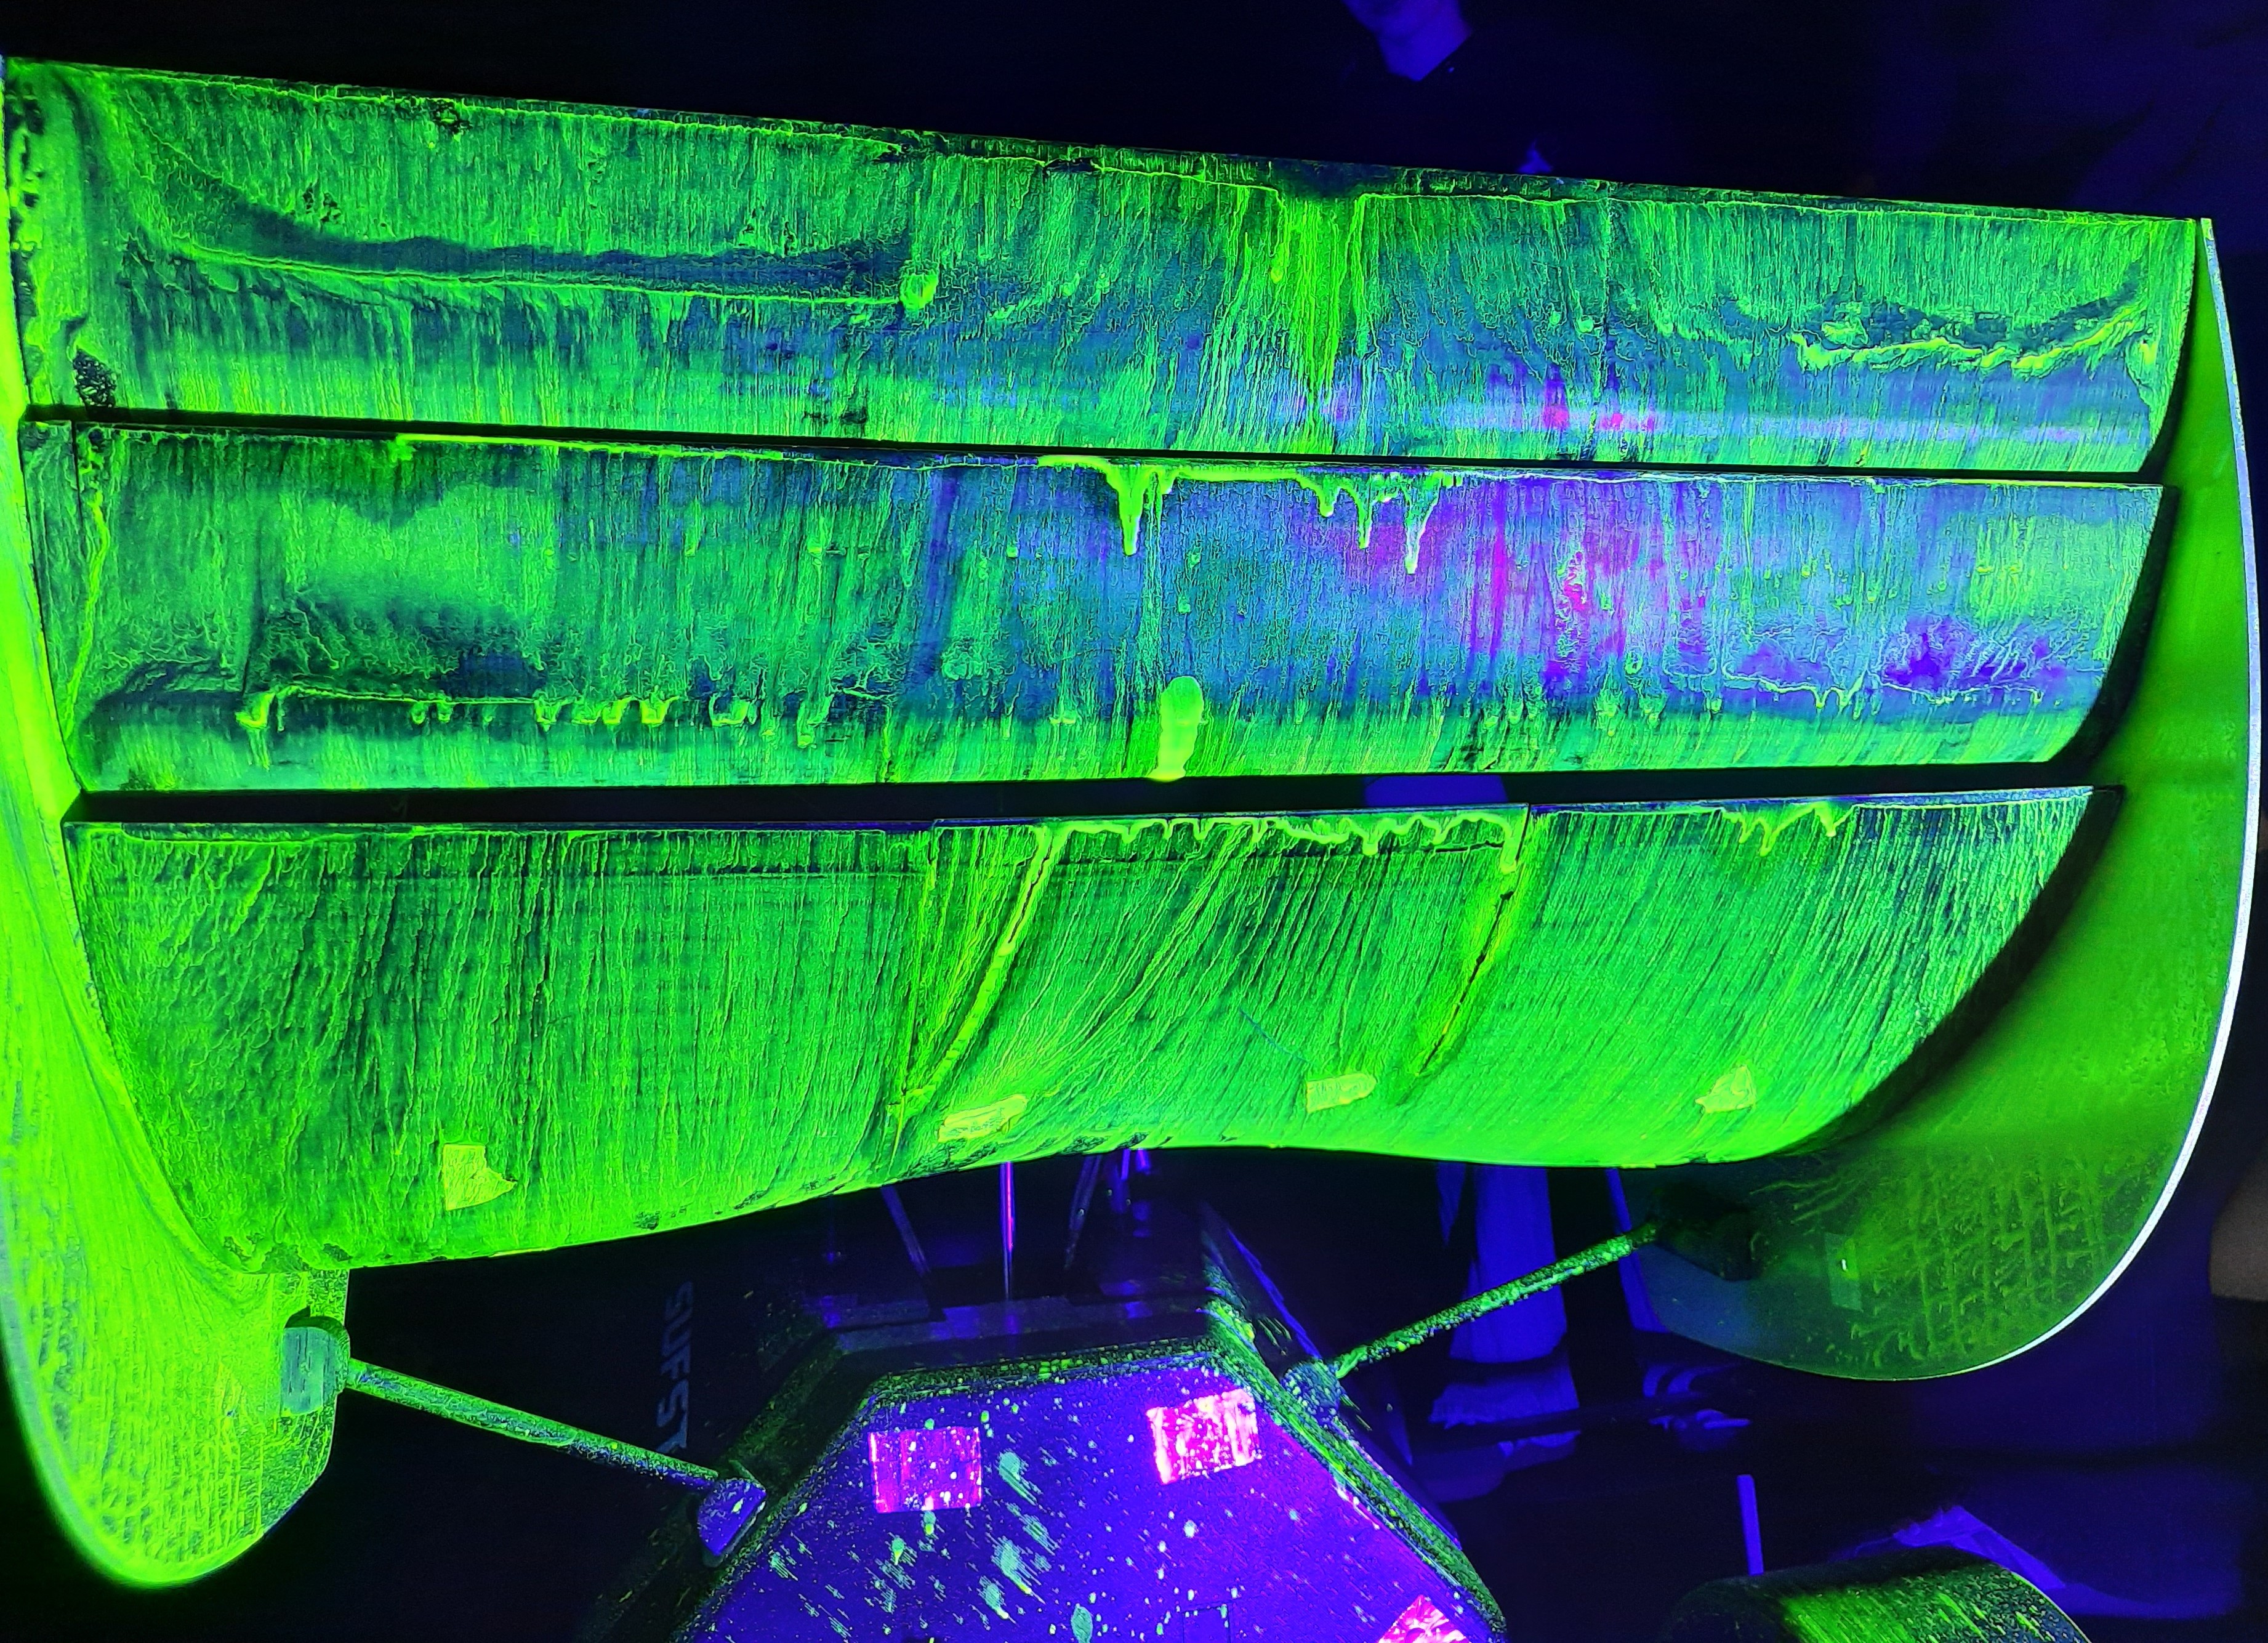
Flow-vis end-plate view.

Alongside balance and pressure readings, we used tufts to observe rear-wing vortex shedding.

Fluorescent flow-vis paint was also applied to map surface flow patterns, mimicking line integral convolution (LIC) oil flow diagrams.

To replicate on-track aerodynamics, the setup utilised a rolling road and boundary layer suction, with individual load cells isolating the drag contribution of each rotating wheel.
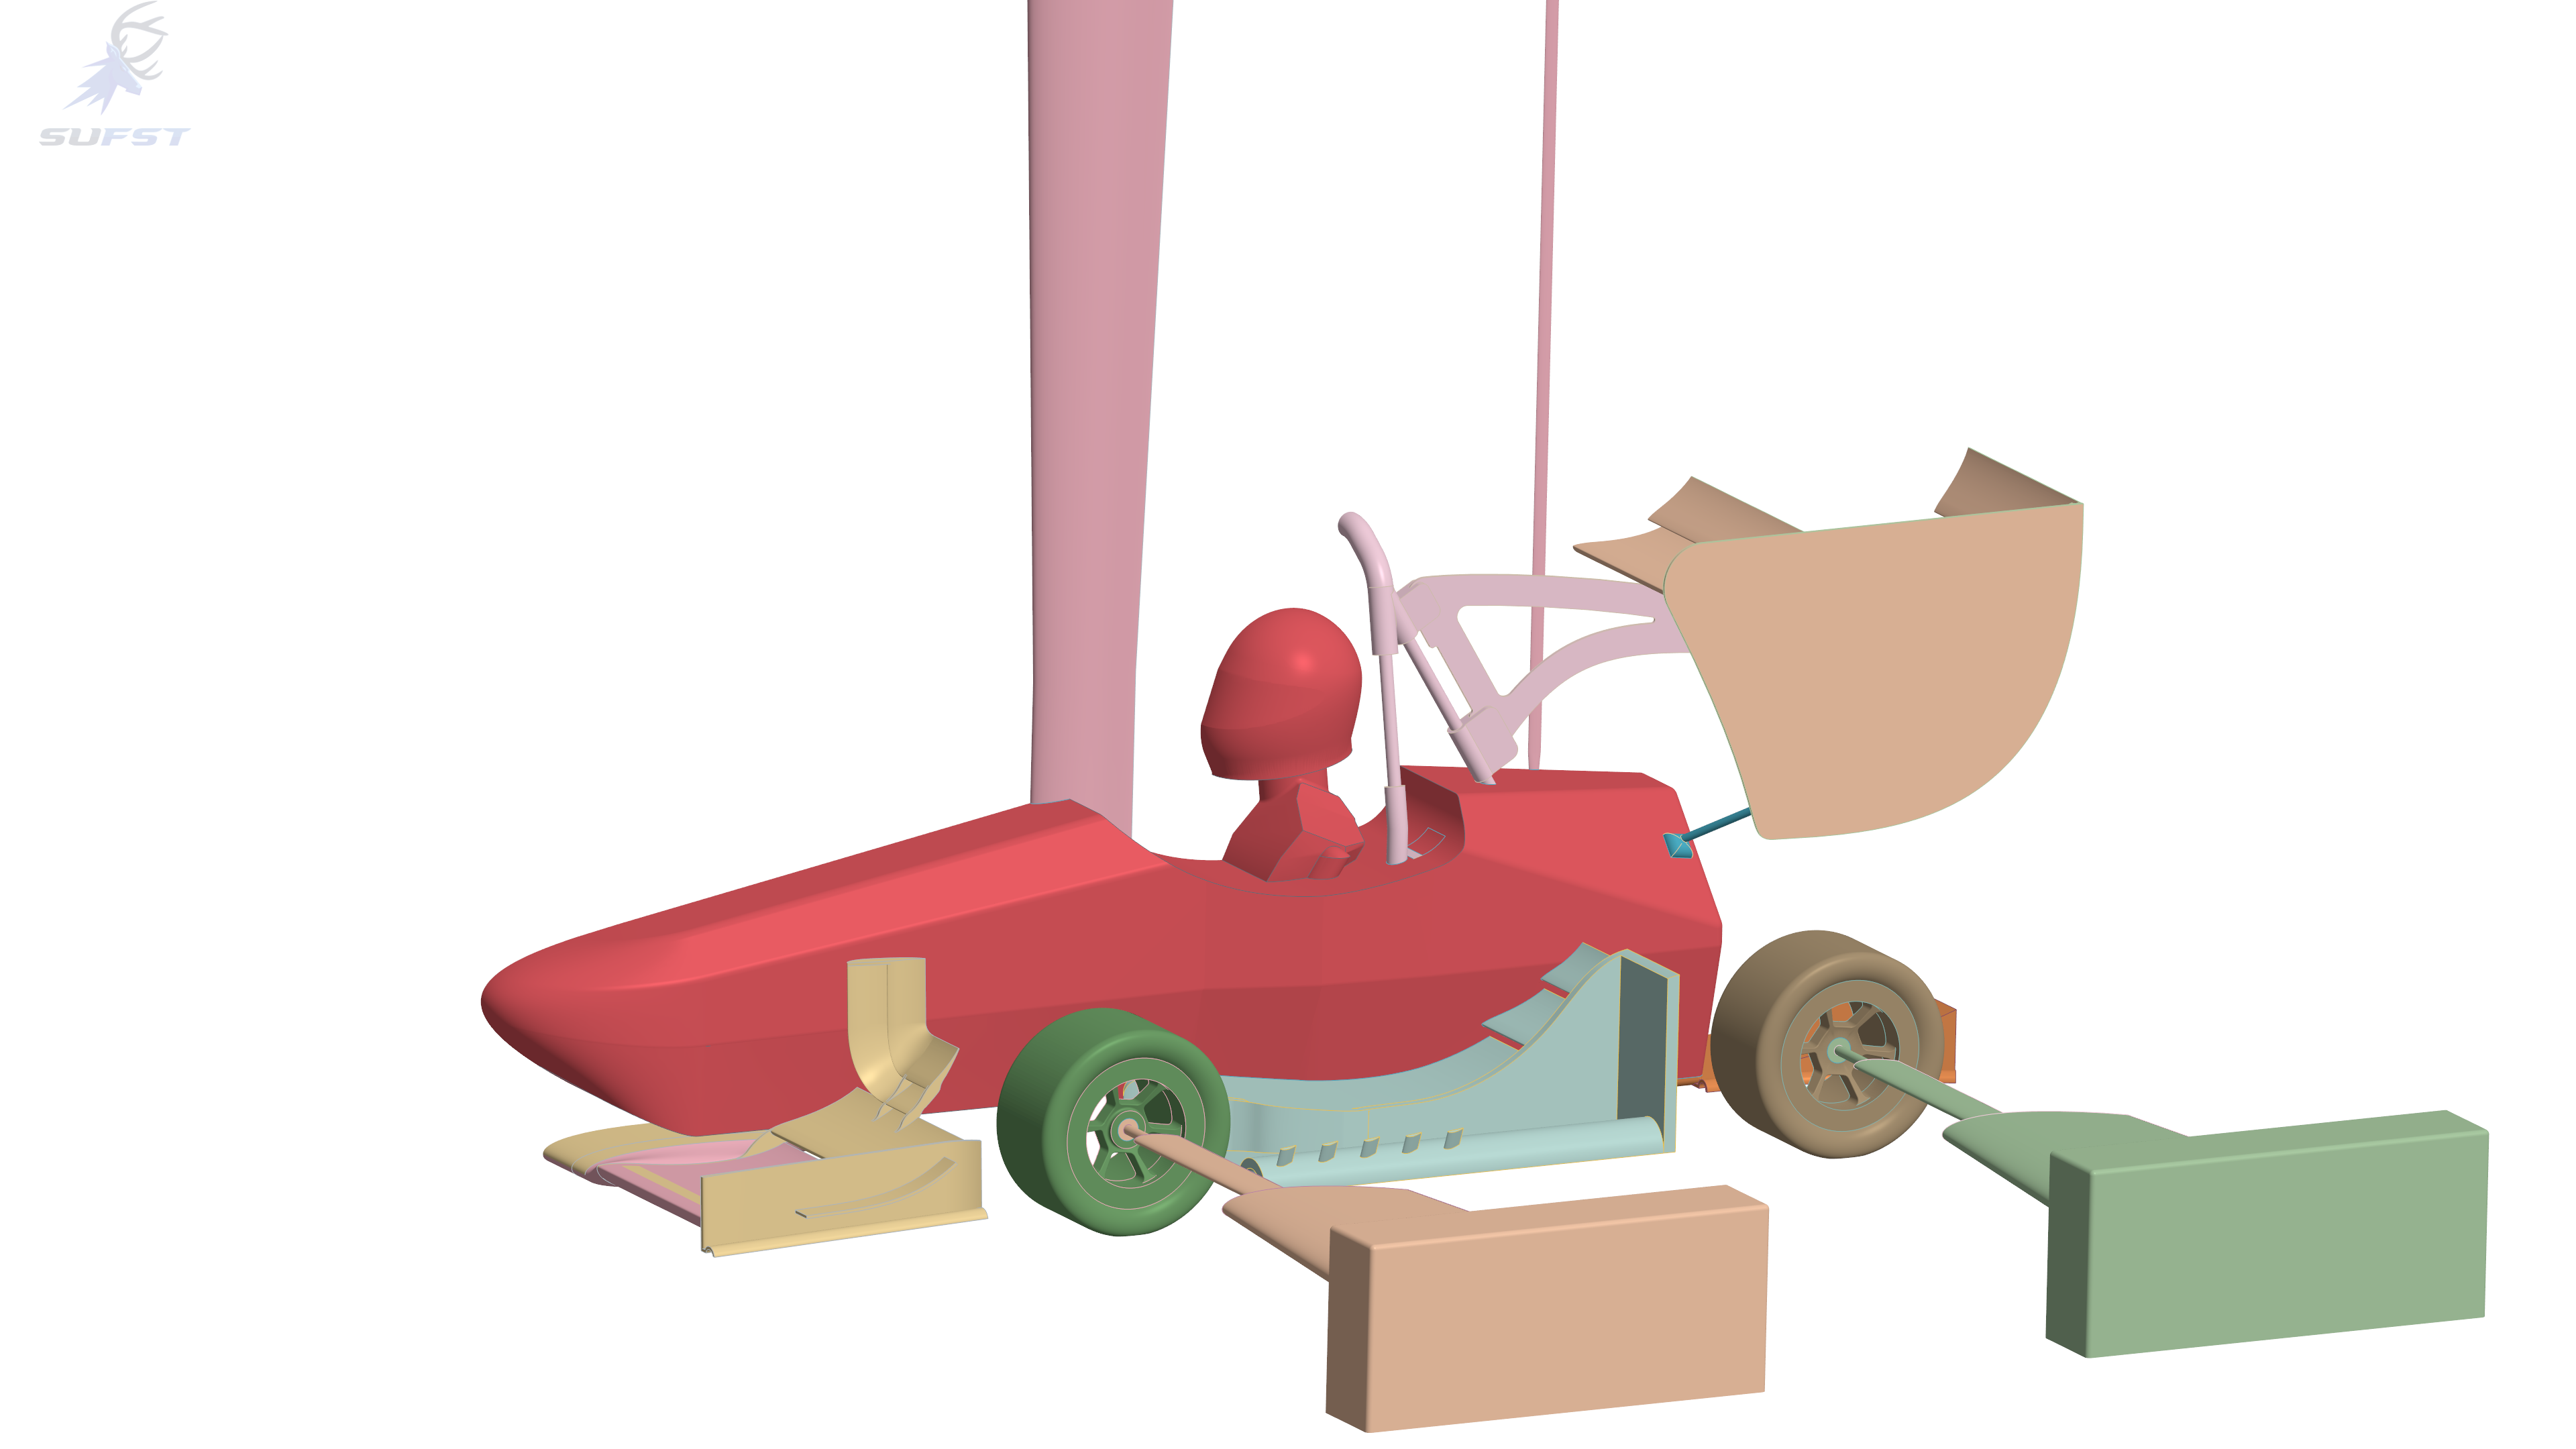
Formula Student CFD geometry

CFD Setup

CFD boundary conditions and turbulence parameters were configured to directly match the physical environment of the R.J. Mitchell wind tunnel.
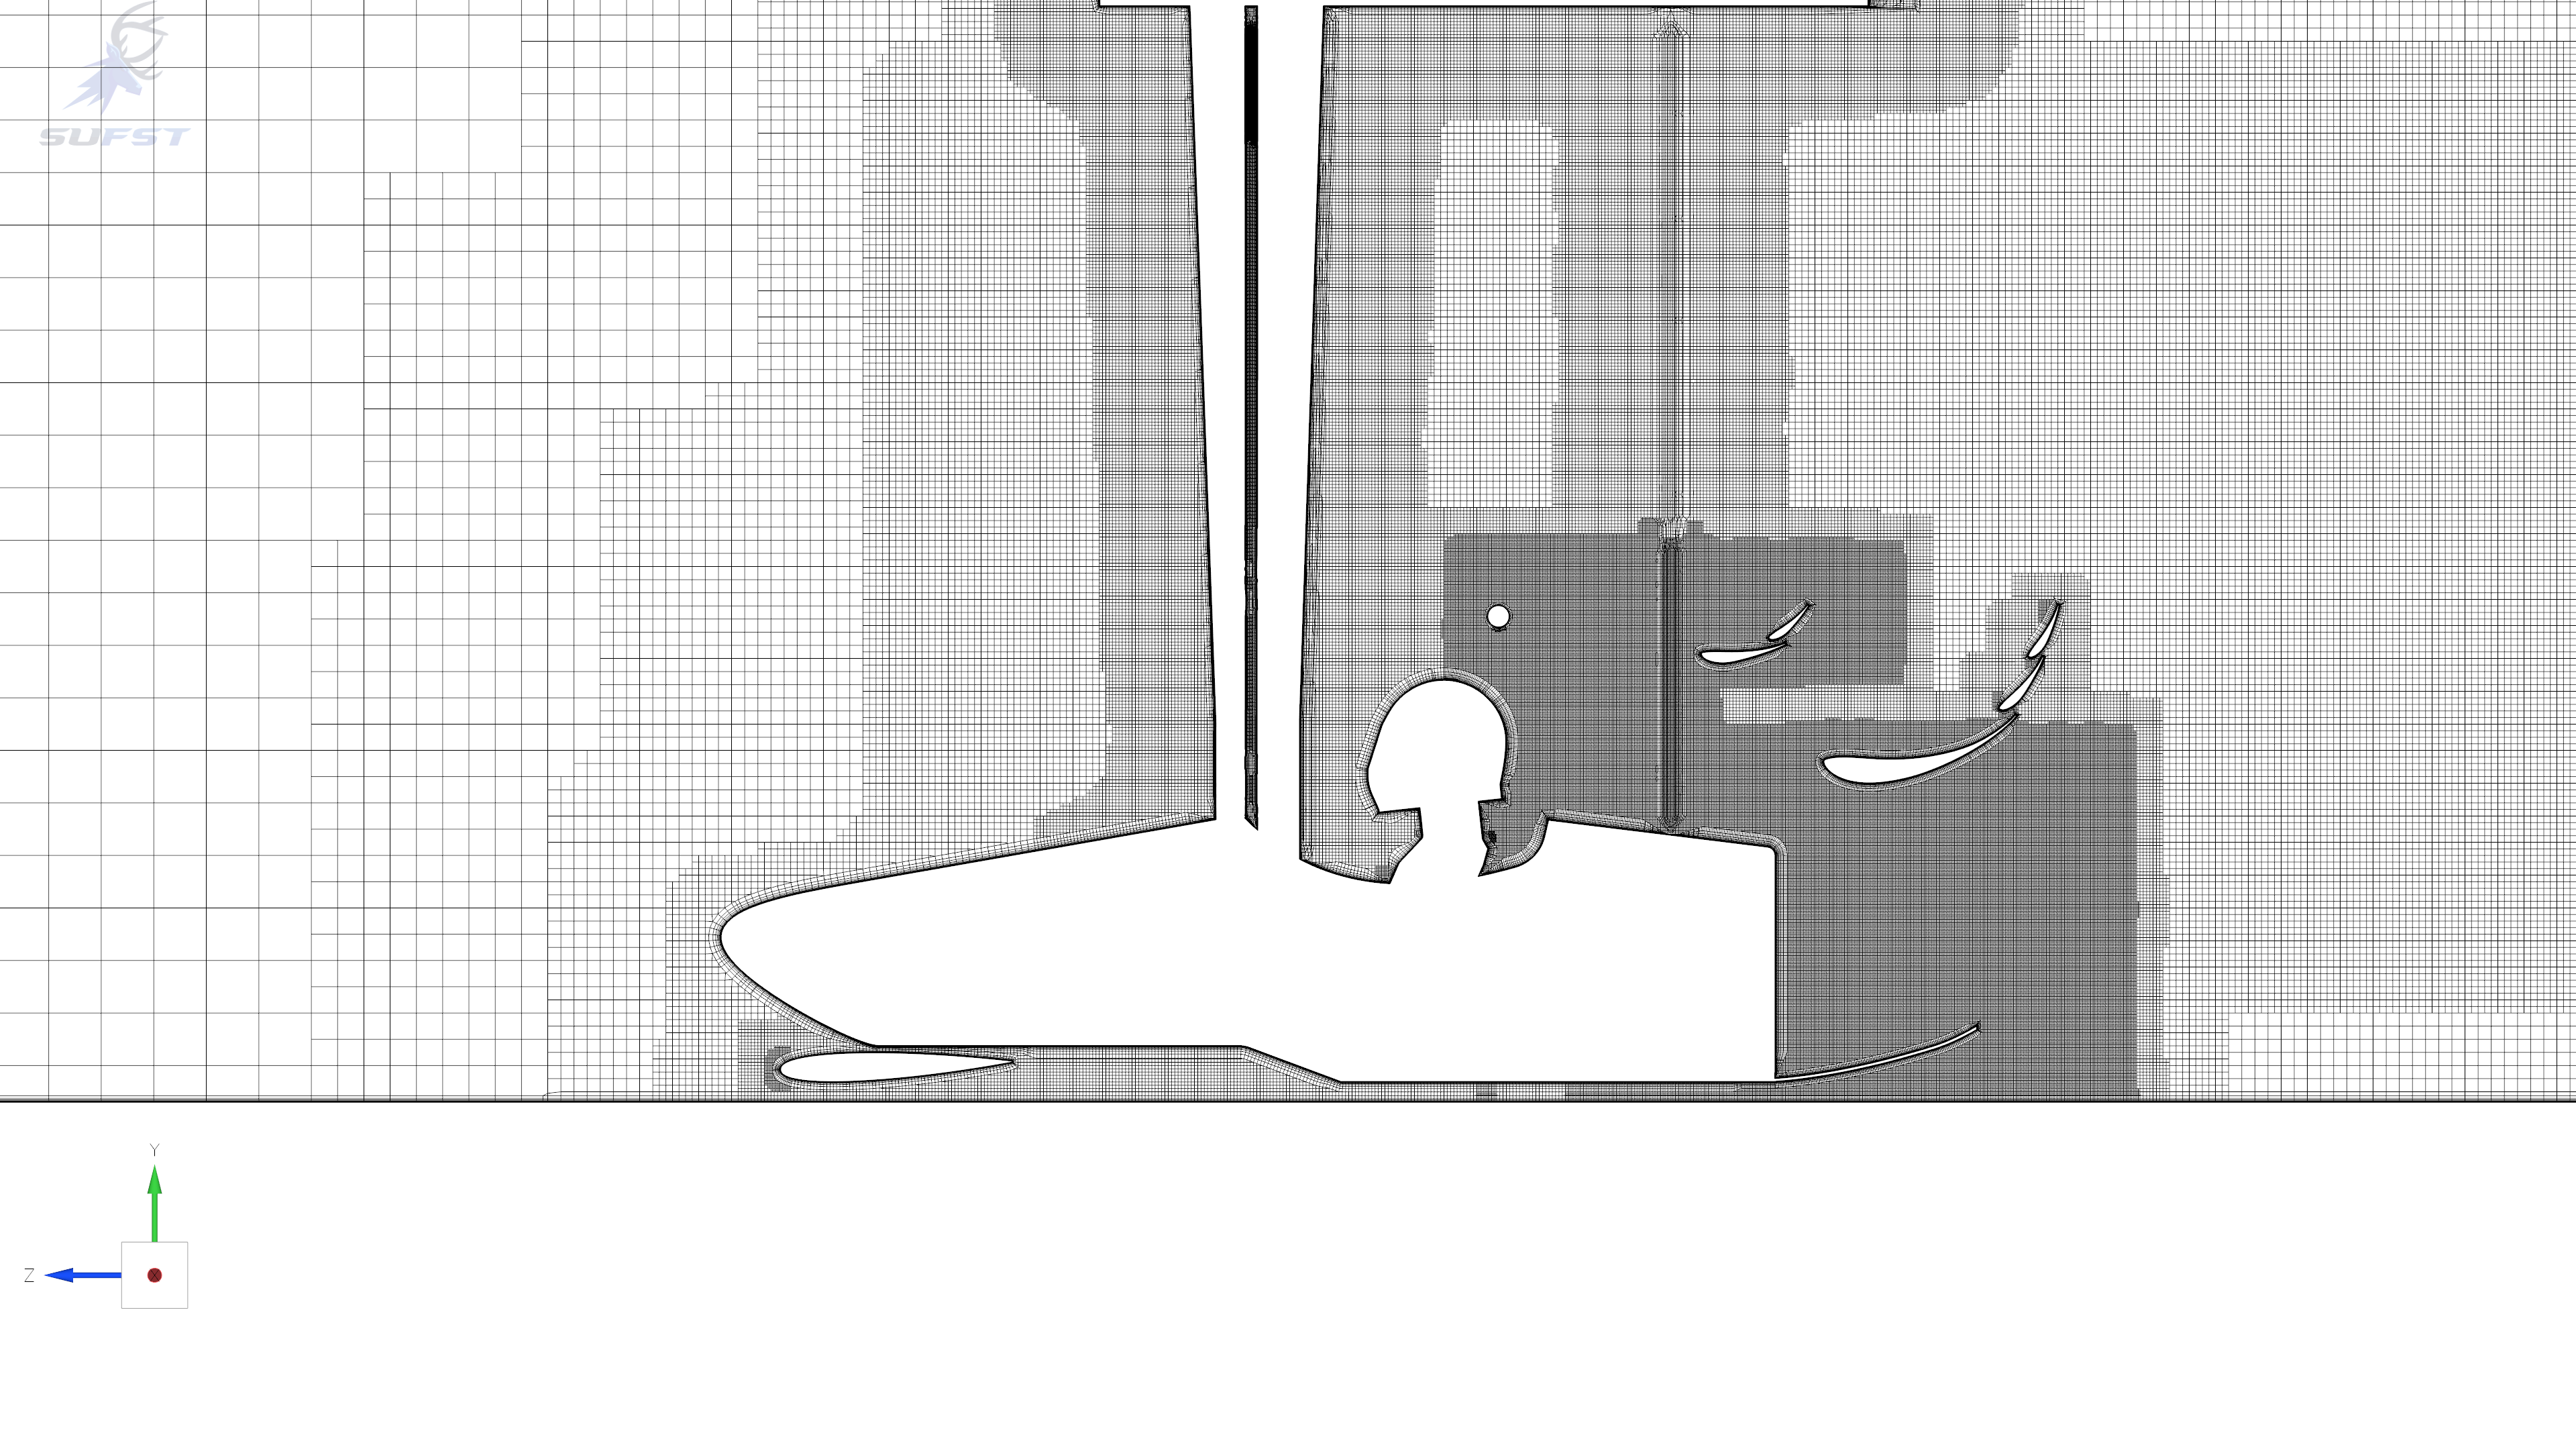
Formula Student CFD mesh

The computational geometry was scaled to match the 50% physical model before applying an iterative meshing strategy. This resolved local flow sensitivities and systematically reduced discrepancies with the wind tunnel data.
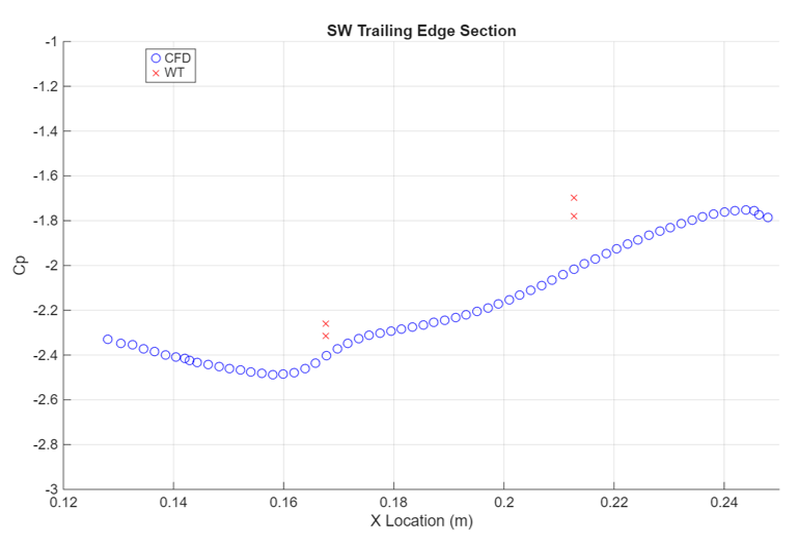
Correlation

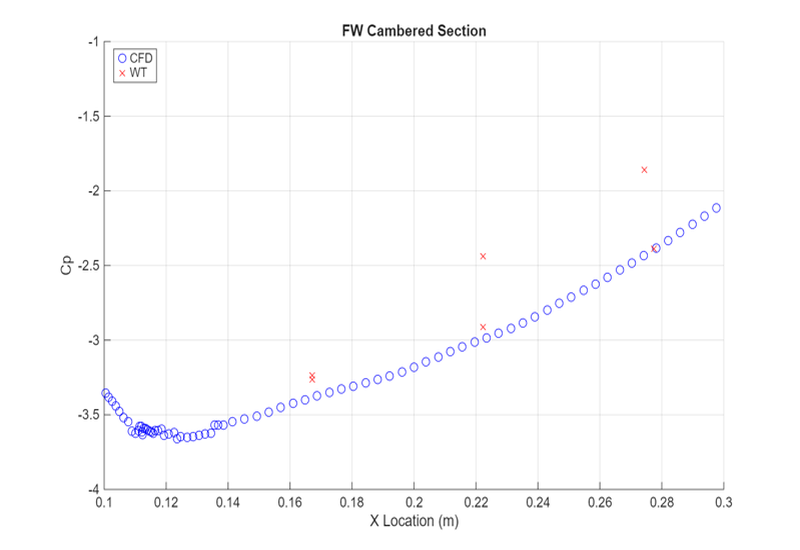
Sidewing trailing edge Cp correlation between CFD and wind tunnel Front wing cambered section Cp correlation between CFD and wind tunnel

Surface Pressure Distributions

Chordwise Cp distributions extracted at the sidewing trailing edge and front wing cambered sections demonstrated strong agreement between the CFD and physical pressure tapping trends.

Turbulence Model Selection

These correlation results were used to evaluate the Lag Elliptic-Blending (Lag-EB) turbulence model against the conventional SST approach. Demonstrating superior agreement with wind tunnel data, Lag-EB was adopted as the primary model, successfully reproducing measured lift-area (SCL) and drag-area (SCD) coefficients to within 5%.

Flow-Vis vs LIC

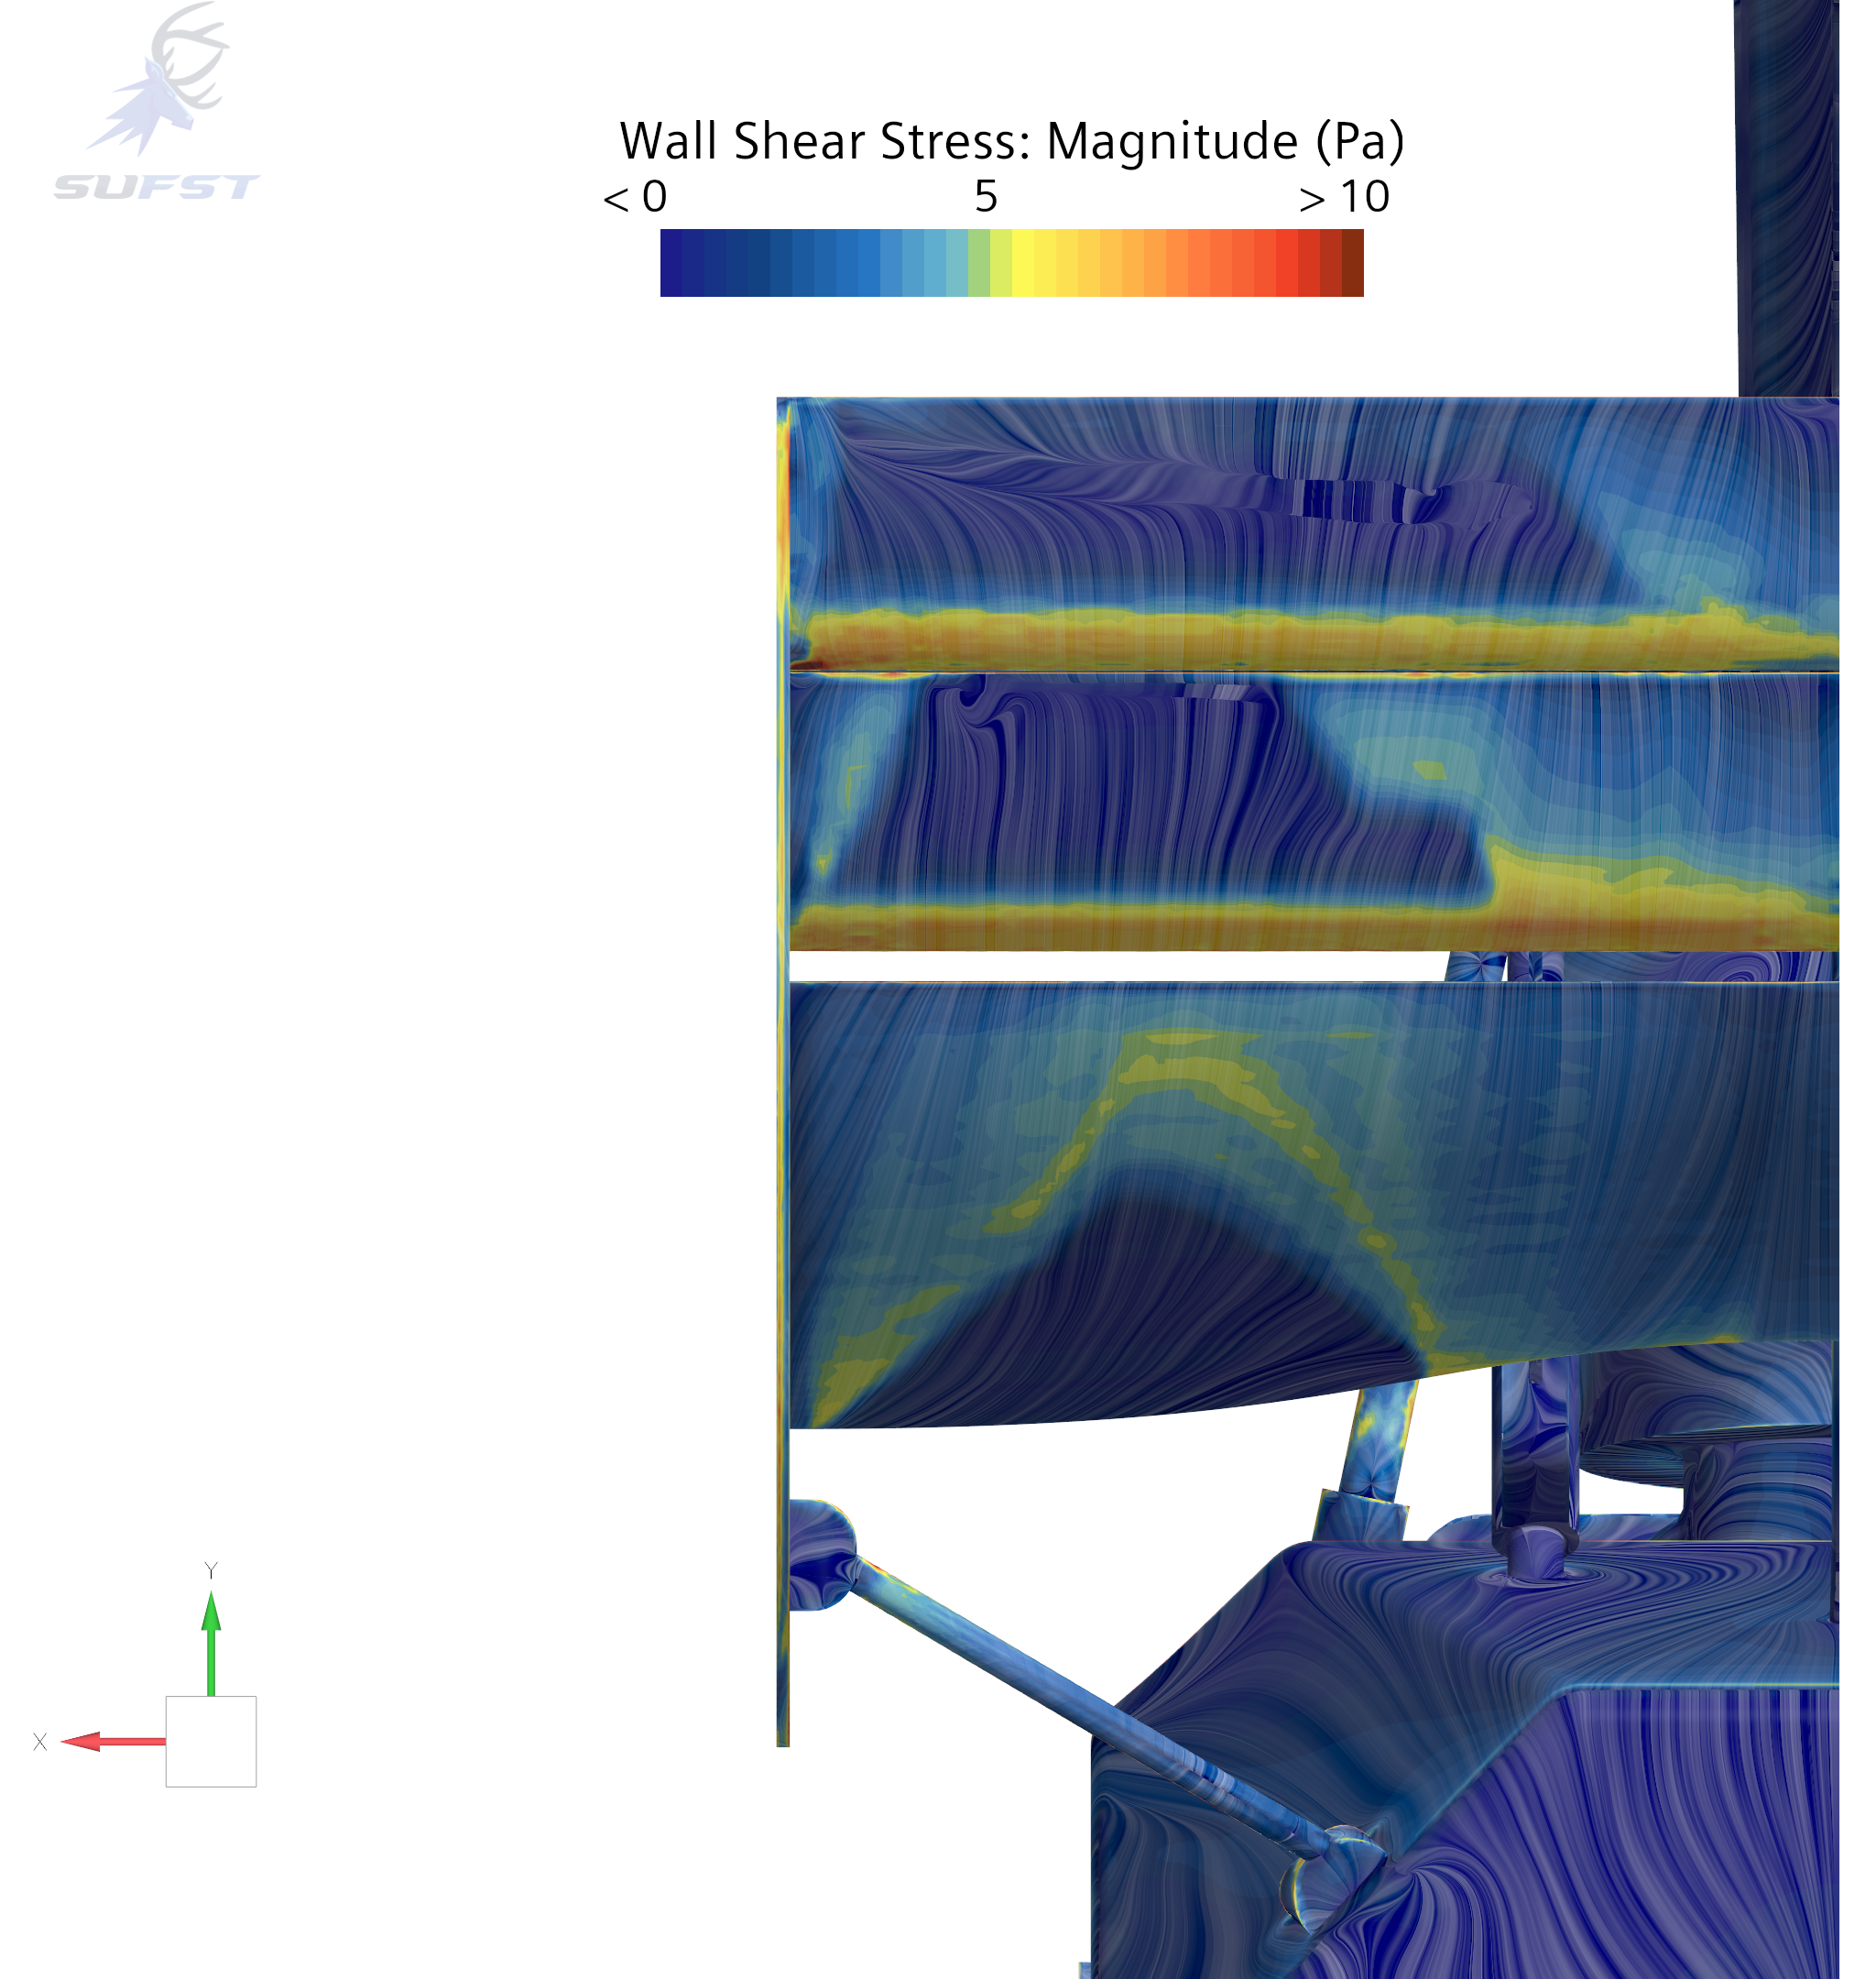
Wind tunnel flow-vis paint traces on the rear wing were compared against CFD wall shear stress LIC contours. The physical paint streaks closely matched the simulated flow structures, particularly the transition regions across the second and third elements.

CFD wall shear stress magnitude on the rear wing, line integral convolution style Wind tunnel flow-vis paint on the rear wing under UV light

Further correlation is seen on the third element, where both a separation-reattachment bubble and central trailing edge separation regions are clearly captured.